The three graphs below show the devastation left in the wake of the Covid vaccination campaign in the USA alone. VAERS is the Vaccine Adverse Events Reporting System, a government database.
All VAERS Reports
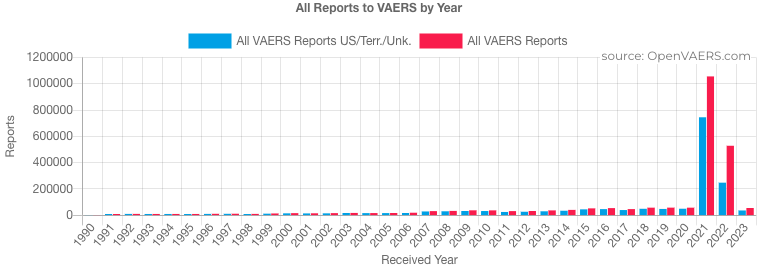
Source: https://www.openvaers.com
VAERS Covid Vaccine Report Summary
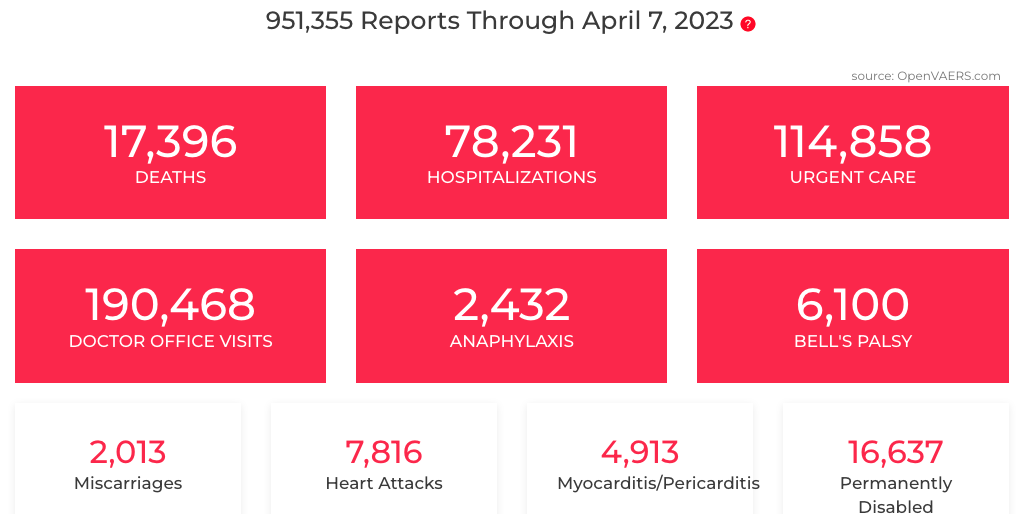
Source: https://www.openvaers.com/covid-data
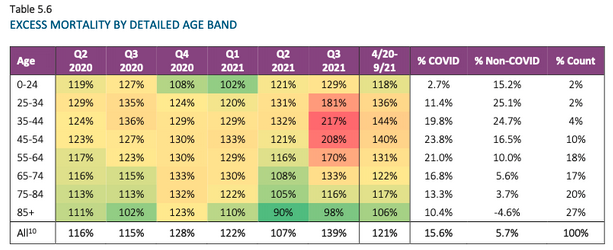
Society of Actuaries Report – Excess Mortality by Age
When looking at the graphs, it is important to keep in mind the under-reporting factor. This factor ranges from 41 (Steve Kirsch’s analysis) to as high as 100 (HHS-funded study).
There were over one million reports to the Vaccine Adverse Events Reporting system in 2021, dwarfing the numbers in a typical year. There have been over 17,000 VAERS reports of deaths from vaccines in the US alone. Assuming a conservative under-reporting factor of 41, that means the number of deaths from Covid vaccines are probably over half a million. The actuarial report shows that excess deaths about six months after the Covid vaccine rollout was around 200% for working age people. This means that for every person in this group and time period who was expected to die, three people actually died. What can explain such an anomaly? Only the vaccines. The vaccines are dangerous – far more dangerous than the supposed threat they are meant to protect you from.