The Hockey Stick Illusion is an extraordinary book looking inside the “science” of paleoclimatology (the science of reconstructing the temperature record into the past for the purpose of identifying trends in the climate). In reading this book I noticed some extraordinary parallels between paleoclimatology “science” and Covid “science”.
First, though, let me provide some context. Climatology, in general, is an immature science. Even its practitioners would have difficulty denying that. Until 1998 one of the things that there was some agreement upon in the field was that temperatures were warmer in the period 1000 A.D. to 1400 A.D. (the so-called Medieval Warming Period – MWP) than they have been in the modern period (see graph below). This understanding was based upon historical references rather than upon hard data since, of course, temperature records did not exist. For example, it is documented that the Vikings colonized both Greenland and Iceland, capitalizing upon the warmer weather.
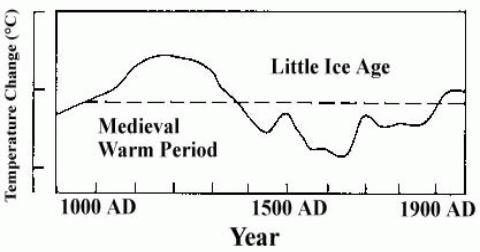
If the weather was significantly warmer in the MWP than it is now this would be a strong indicator that human industrial activity is not the sole factor – perhaps not even an important factor – for global temperature.
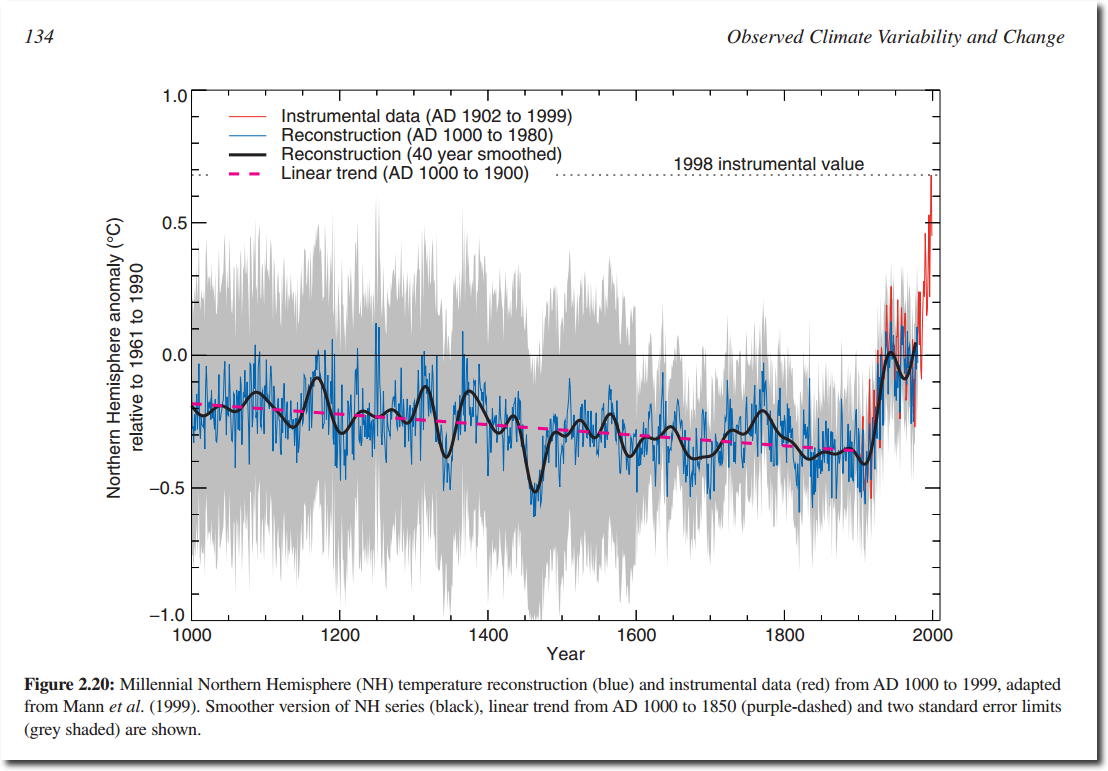
This understanding about the MWP was challenged by a scientific paper by Michael Mann, et. al., in 1998. (Mann’s paper a year later extended the time period far enough back to remove the MWP, entirely flattening it out). The paper was seized upon because it provided a scientific backing for the idea that increases in CO2 were causing the temperature to rise. The climate science community embraced it. Media sensationalized the findings. The political/governmental community also embraced it and began to act upon it. Whether politicians acted out of genuine concern, as a convenient political lever, or in service to an agenda, this article will leave to the reader’s imagination.
To make matters easy for all concerned, the findings of the paper could be summed up in a single graph depicting temperature over time (see graph below). This graph had the shape of a hockey stick – a long straight handle and a blade sticking up sharply at the end. One didn’t need to know any of the science. Just look at the graph and it was obvious that global temperature was taking a dramatic turn upward. Gulp! This means trouble, the graph seemed to exclaim.
The only problem was that the graph was wrong. It was based upon faulty data AND upon faulty statistical methods. There were many problems with the data, and the book describes them in extraordinary detail. To simplify the matter to the very basics: there were no temperature records going back as far as 1000 A.D. so proxy (indirect) data was used instead. This data included tree ring and ice core data from which temperatures were inferred with mathematical formulas. In essence, the book shows tree ring data, in general, to be a bad proxy for temperature. And it shows that the proxies chosen were cherry picked to provide certain results. Computer scientists sum up such a situation as GIGO – garbage in, garbage out.
Now that the background has been laid we can already see some parallels with Covid-19. The idea that there was a new and dangerous new disease had equally little science to back it up. The data that was claimed to back up the new and dangerous disease idea was proxy data, just as was the case with the hockey stick. Early on, the WHO Director told the world to “test, test, test” and the only test in town was the PCR test. This test did not find a virus, it merely inferred the existence of a virus from proxy data, in this case, the existence of certain nucleotides that were claimed to be unique to a new virus.
It is not clear that even a positive test was an indicator of anything new as the test was developed using “primers” for previous coronaviruses. Also nothing could be inferred as to infectiousness because the test could not discriminate between a live and a dead virus.
The point is that, just as the tree ring proxy data was shown to be greatly flawed in the case of the hockey stick paper, the PCR proxy virus data is also flawed. The Corman Drosten Review paper systematically destroys any scientific basis upon which to use the PCR test, much as The Hockey Stick Illusion systematically destroys the basis upon which to rely on (certain) tree ring data for the purpose of reconstructing the temperature record. The Corman Drosten Review highlights 10 major problems with the PCR test including lack of standard operating procedure, no specification for the cycle threshold value, and even conflicts of interest of the authors.
Another parallel between the hockey stick paper and the Covid narrative is the disingenuous use of statistics. It’s been said that there are “lies, damned lies, and statistics” and in the case of the hockey stick and Covid, the narrative of impending danger slowly falls apart when looking at how the statistics were utilized to support a narrative. In the case of the hockey stick the book shows how statistics were used to skew the results toward creating a hockey stick-looking graph out of the data. Also some of the proxy data was cherry-picked (specifically chosen to support a desired result while other data was rejected).
During the Covid era the statistics have also been distorted:
– Even if one were to believe that the Covid tests actually test for a virus, a positive case is meaningless without an understanding of the “cycle threshold,” a test parameter that hasn’t been standardized, and that Fauci admitted is usually run at too high a setting.2
WHO has also admitted that a test by itself is insufficient for a diagnosis.3
Strangely, the cycle threshold of tests is not usually documented or reported along with the results, making it impossible to audit older results for quality.
– Covid deaths are similarly exaggerated by including deaths of old people with many co-morbidities who may well have died even without “getting Covid.” The CDC admits as much in their weekly MMWR report saying that 95% of those dying with Covid have at least one comorbidity and an average of four!4
– Another parallel that I found between the hockey stick story and the Covid story was the censorship involved in both cases. Dissenting views had a hard time of getting a hearing. And, in both cases, the dissenters had much in common. They were not people coming from the fields in question but from other fields that were peripheral to it (and perhaps, therefore, not subject to groupthink). Furthermore, the dissenters in both cases are older individuals, sometimes retired (and perhaps, therefore, less concerned about any negative fallout from their position).
I recall having read Inventing the AIDS Virus by Peter Duesberg. The parallels abound, once again, between the AIDS era and the Covid era. Many considered Duesberg’s previous research in virology to be Nobel-worthy. Yet his dissenting opinions regarding the dangers of HIV led to him being, perhaps, the original victim of cancel culture – his funding completely dried up, he became a scientific outcast and he was fortunate to maintain his teaching position. I suppose he got off better than many Covid dissenters who were fired from jobs.
Duesberg’s book covers some of the statistical shenanigans from the AIDS era, in particular, reclassification. Once a test for HIV (the ostensible AIDS virus) was available, the medical community made a giant pivot. Before long, about 30 different diseases would now be reclassified as AIDS, if there was a positive HIV test. The symptoms would be identical to another disease but it would then be called AIDS because of a test. Naturally, the number of AIDS cases and deaths then skyrocketed providing a basis for experimental treatments as well as a general environment of panic. There is also a parallel between the use of AZT in AIDS patients (actually many treated with AZT had no symptoms but were scared into treatment by a positive test) and Remdesivir in Covid patients. Both medications proved deadly to many that took them.
In The Hockey Stick Illusion the author discusses how his book was preparing for publication in 2009 when the climatology field was shaken by the scandal of the hacking of data from the Climate Research Unit of the University of East Anglia. Amongst the hacked information were email exchanges between many of the insiders of the paleoclimatology community. These emails made it clear that they were not happy with the “skeptic” scientists, that they bemoaned that there were journals publishing the skeptics’ papers, and that they were completely uninterested in whether the skeptics’ work had any merits! In other words, they were not interested in the scientific process itself! Sadly, this is much the same in the Covid era as Covid skeptics are called conspiracy theorists and science deniers.
Appendix:
A global network of 500 scientists and professionals declare, “There is no climate emergency.”
Sources:
2 Tony Fauci: “It’s just dead nucleotides, period.”
3 WHO Modifies CCP Virus Test Guidelines, Warns Against Overreliance on PCR Results
4 Weekly Updates by Select Demographic and Geographic Characteristics